This El Niño tracks 1997’s giant event, and NASA says it may grow bigger
A 35-year run of NASA sea-level satellites shows October 2026 looking much like October 1997, one of the strongest El Niños on record, and a NASA scientist says this one is on track to be bigger.
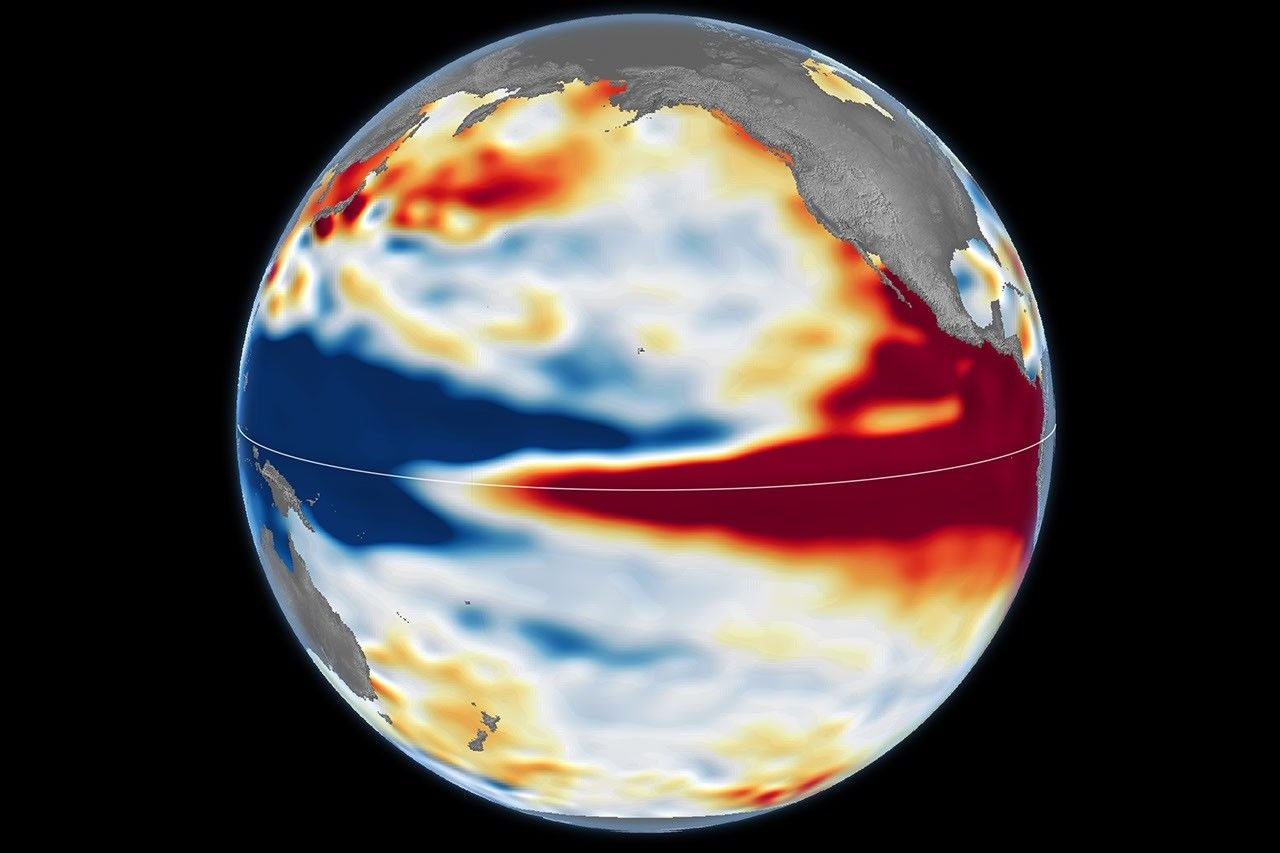
NASA satellite maps released on October 23 show the Pacific Ocean in October 2026 looking much like it did in October 1997, the year of one of the strongest El Niño events on record. According to NASA’s Earth Observatory, this one is on track to be even bigger.
Sea level as a thermometer for the Pacific
El Niño is a natural climate pattern that returns roughly every two to seven years and brings warmer-than-normal water to parts of the equatorial Pacific. NASA tracks it from space with altimetry satellites, which measure the height of the sea surface. The method works because water expands as it warms, so a bulge of high sea level in the central and eastern equatorial Pacific marks a buildup of heat.
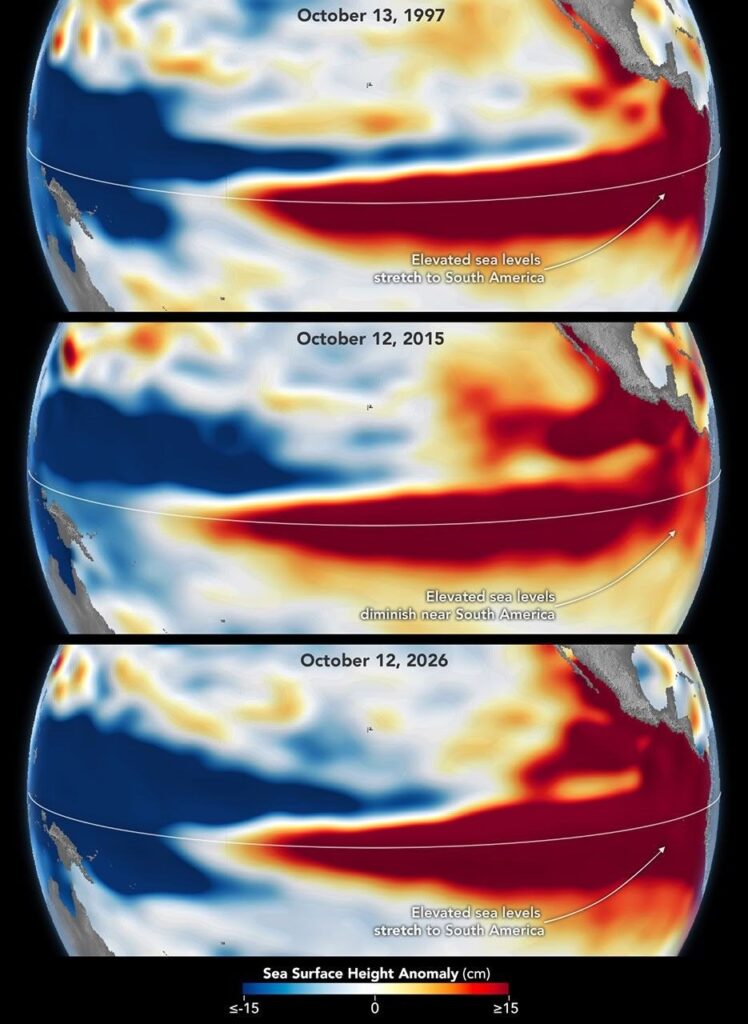
The comparison uses sea surface height anomalies, meaning how far the sea surface sits above or below its average level. Seasonal cycles and long-term trends were removed so that El Niño stands out. Red shows higher-than-average sea level, white is normal and blue is lower. The 1997 map comes from the TOPEX/Poseidon satellite and the 2026 map from Sentinel-6 Michael Freilich, both processed at NASA’s Jet Propulsion Laboratory (JPL).
In both maps the sea is low in the west and high in the east, and the warm, high water stretches all the way to the coast of South America. That tilt is the signature of a mature event.
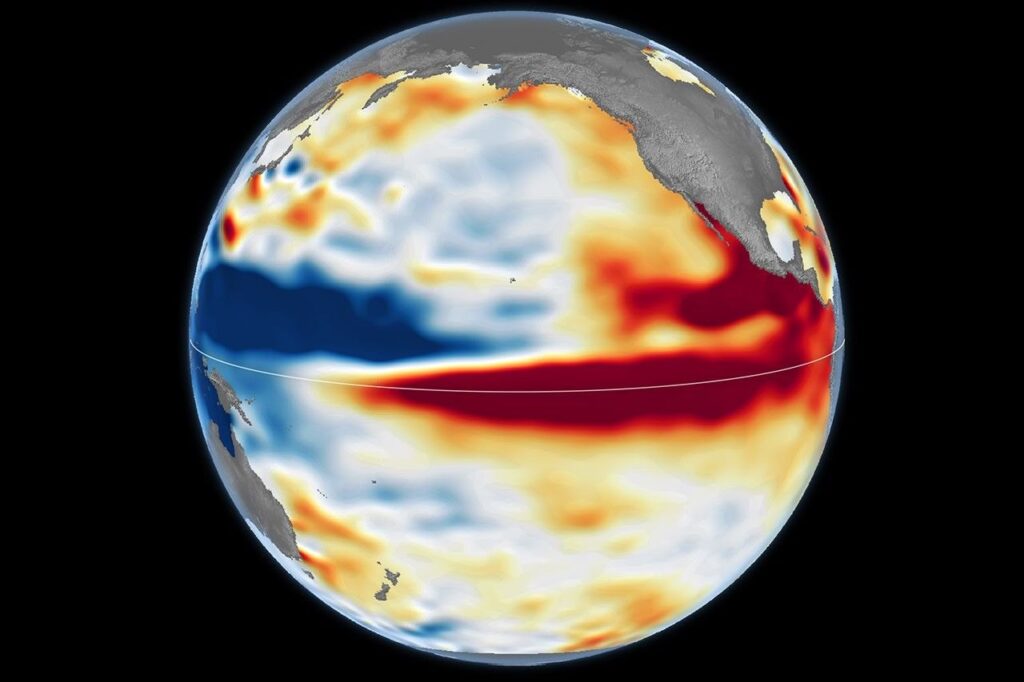
NASA says the 2026 event came on much more suddenly than the one in 1997-98, yet by October the two look similar in character. “What’s unique about altimetry is that we have a 35-year record from nearly identical satellites flying almost the same ground track, with each mission overlapping the next,” said Josh Willis, project scientist for sea level missions at JPL. He added: “And right now, this one is on track to be even bigger.”
How the feedback loop builds
Trade winds normally keep warm water piled up in the western Pacific, where the sea stands higher than in the east. When the winds weaken, that warm water starts to flow east, which weakens the winds further and sometimes reverses them. More warm water then moves east, and the cycle feeds itself while the central and eastern Pacific keep warming.
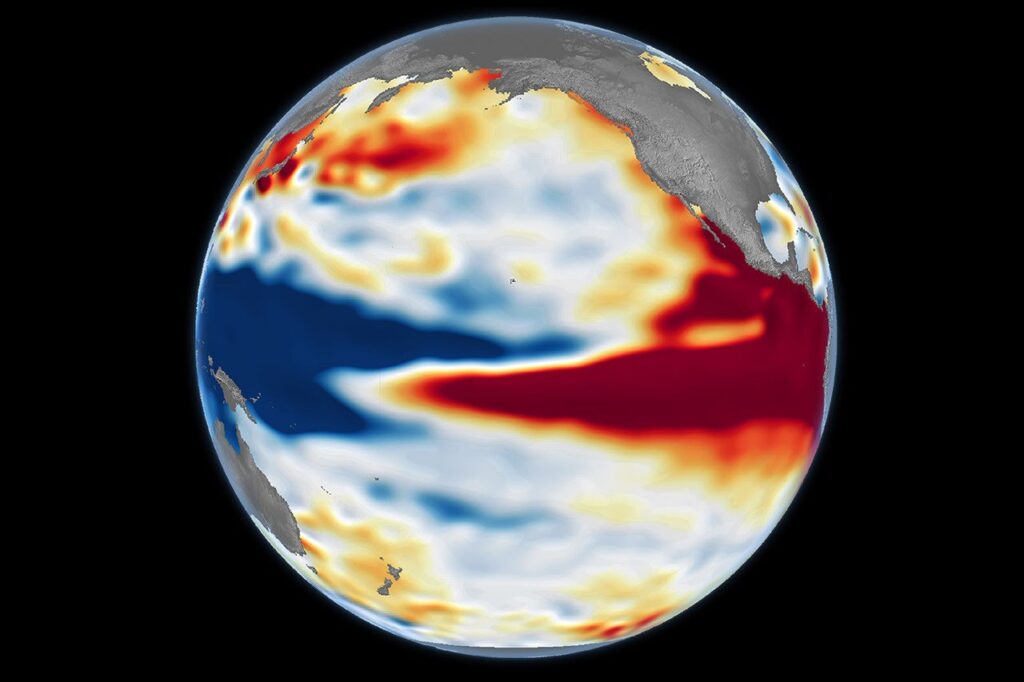
NOAA declared the current El Niño on June 11, according to an earlier NASA Earth Observatory report. It came after sea surface temperatures in the central and eastern equatorial Pacific had been at least 0.5 degrees Celsius above average for several consecutive months.
1997, 2015 and 2026: Three strong events, three different shapes
Strength is not the only thing that matters. NASA’s third map, from October 2015, shows the other recent very strong El Niño. Its warm, high water stayed farther offshore and did not push against South America as it did in 1997 and does in 2026. Rainfall that winter fell mostly over Central America and the southeastern United States, with significant flooding in Mexico.
In 1997-98, by contrast, California and the southern tier of the United States got heavy rain. Both of those events upended weather worldwide, from fires in Indonesia and the Amazon to drought-driven crop failures in southern Africa and coastal flooding in Southern California.
“The search for the ‘typical’ El Niño is very elusive,” Willis said. Because 2026 reaches the South American coast like 1997, he thinks its impacts could be similar too.
Measured against its predecessors
For forecasters, the two earlier events are the benchmarks. In its October 8 outlook, NOAA put the odds at 83 percent that the event will be strong or very strong at some point through the first quarter of 2027, as NASA reports.
The fires are already making the comparison concrete. Our report on the record burning in Papua New Guinea, based on NASA data, found that fires there had released nearly 32 megatons of carbon by October 19, more than in any earlier year at that point. Fires on the Indonesian side of the island passed 35 megatons, the third-highest total on record after 1997 and 2015. Those are the same two years NASA now uses as yardsticks for the ocean, so the land and sea records point the same way.
That fire season also shows why the ocean maps matter. Southern New Guinea went unusually dry as the Pacific warmed, and the dry weather, not the ocean heat itself, is what let human-set fires spread out of control. The altimetry shows the heat; the weather impacts depend on how the atmosphere responds.
A forecast with a margin of error
Scientists stress that the match with 1997 is a best guess. El Niño’s influence travels through a chaotic atmosphere, and the signal can get muddled once it moves beyond the tropics. “There’s always a bit of a dice roll here,” Willis said. “Just because this El Niño looks like 1997 doesn’t mean it will be exactly the same – it’s just our best guess at the moment.”
How the winter of 2026-27 plays out therefore remains open. The satellites will keep measuring the sea surface, and each new map will show whether the warm water keeps piling up against South America as it did in 1997.