Northern lights forecast: how to read NOAA’s aurora maps, Kp and when to look
NOAA's 30-minute aurora map, the Kp index and a clear, dark sky decide whether you can see the northern lights tonight. This guide explains each and the best hours to look.
Dates and facts checked on the official pages on October 17, 2026.
The northern lights forecast to check first is NOAA’s Aurora – 30 Minute Forecast, a map of the aurora oval that gives a 30 to 90 minute lead time. Pair it with the Kp index and your local cloud forecast, because aurora is only visible on a dark, mostly clear sky.
NOAA’s Space Weather Prediction Center (SWPC) says the best aurora usually comes within an hour or two of local midnight, roughly 10 PM to 2 AM. Nothing here is a live claim: whether lights are visible tonight depends on the data on the official pages linked below, which change by the minute.
The 30-minute map shows where the oval sits right now
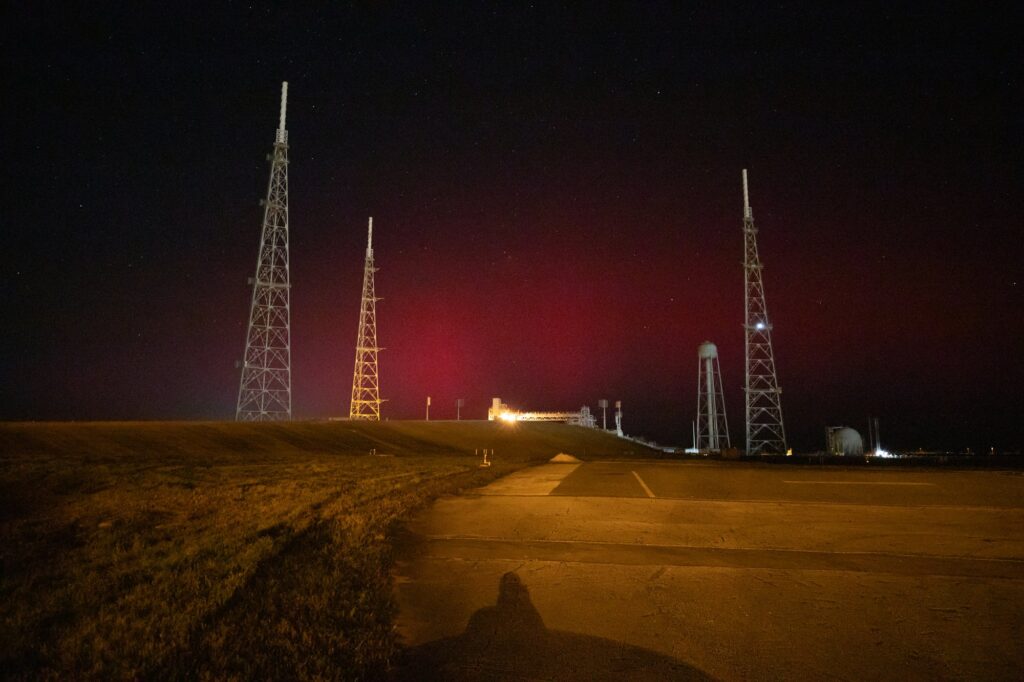
The Aurora – 30 Minute Forecast is built on the OVATION model. It has two maps, one for each hemisphere, centered on the magnetic pole. The aurora appears as a green oval, and the oval turns red when the aurora is forecast to be more intense. The sunlit side of Earth is drawn in lighter colors, so you can see where it is day.
Read it on the night side. Aurora is not visible in daylight, so a bright oval over a sunlit region means nothing for viewers there.
The lead time comes from the solar wind. OVATION uses solar wind speed and the interplanetary magnetic field measured at the L1 point, about 1.6 million km upstream of Earth. The lead time is how long that wind takes to travel from L1 to Earth. If that data is contaminated or missing, the model falls back on the current Kp index, and in that case NOAA says there is no forecast lead time.
SWPC also notes that aurora does not have to be overhead. It can be seen from as much as about 1,000 km away when it is bright and conditions are right. That is why you look toward the pole, at the northern horizon in the Northern Hemisphere.
Kp 5 is a minor storm, and each step reaches farther south
The Planetary K-index (Kp) is a number that measures how disturbed Earth’s magnetic field is, on a scale of 0 to 9. The higher the number, the farther south the aurora can reach. It is the mean standardized K-index from 13 geomagnetic observatories between 44 and 60 degrees geomagnetic latitude, reported in 3-hour intervals. SWPC says its chart updates every minute.
SWPC’s viewing tips give the rule of thumb: the equatorward edge of the oval sits near 66 degrees magnetic latitude at Kp 0 and moves about 2 degrees per Kp level, reaching about 48 degrees at Kp 9. These are averages, not exact limits.
The NOAA Scales turn Kp into storm levels and give the reach of the aurora:
| NOAA scale | Kp | Aurora visibility, per NOAA |
|---|---|---|
| G1, minor | 5 | Commonly visible at high latitudes (northern Michigan and Maine) |
| G2, moderate | 6 | About 55 degrees geomagnetic latitude, down to New York and Idaho |
| G3, strong | 7 | About 50 degrees, down to Illinois and Oregon |
| G4, severe | 8, including 9- | About 45 degrees, down to Alabama and northern California |
| G5, extreme | 9 | About 40 degrees, down to Florida and southern Texas |
Figures checked on October 17, 2026, on NOAA’s Space Weather Scales page.
SWPC’s tips page describes the lower end of the scale this way: at Kp 0 to 2 the aurora is far north, dim and not very active; at Kp 3 to 5 it moves toward lower latitudes, brightens and shows more motion. In a good location, strong displays can appear even at Kp 3 or 4.
The midnight hours give the best odds, and the equinoxes the best seasons
SWPC says the best aurora is usually within an hour or two of midnight, between about 10 PM and 2 AM local time. As geomagnetic activity rises, that window stretches toward evening and morning. Arcs often form in the evening, then begin to twist and sway near midnight, and activity can peak in a substorm when arcs expand to fill the sky.
For Fairbanks, the University of Alaska Fairbanks Geophysical Institute says the hours from about 11 p.m. to 1 a.m. offer the best chance of bright arcs. It adds that in late August and September, displays tend to start late because twilight lingers for hours after sunset.
SWPC names the spring and fall equinoxes as the best seasons, since larger geomagnetic storms tend to occur then. It also warns that darkness hours drop quickly near the spring equinox and grow quickly near the fall equinox. In summer at auroral latitudes, the midnight sun prevents observations. A summer trip to the Arctic for aurora usually does not work.
The full moon does not make the aurora dimmer, but SWPC says it reduces how bright the display looks against the sky.
The tonight and tomorrow night map no longer draws a view line
The map NOAA publishes for the coming nights is its tonight and tomorrow night product. It is still labeled experimental and shows forecast maps of aurora intensity and location over North America.
NOAA’s page states that in May 2026 the viewline was removed from this product. Older screenshots and articles that show a line marking the southernmost place to look may therefore be out of date.
The product is driven by the SWPC 3-Day Geomagnetic Forecast, using the maximum forecast Kp between 6 pm and 6 am US Central Time. That makes it a planning tool for the coming one or two nights, while the 30-minute map is the tool for the next hour.
The 3-Day Forecast text product is issued every 12 hours, at 0030 and 1230 UTC, with observed and forecast conditions for the G, S and R scales and a forecaster rationale.
A five-step check answers whether you can see aurora tonight
No official page can say “yes” in advance, but a short routine tells you whether tonight is worth a try where you live.
- Check the 3-day outlook. Read the G-scale forecast and the tonight and tomorrow night map for the highest Kp expected during your local night.
- Compare Kp with your latitude. Use the table above. A location at about 50 degrees geomagnetic latitude needs roughly Kp 7, according to NOAA’s scale.
- Open the 30-minute map after dark. Look for the oval on the night side, and for red shading in the direction you will face.
- Check your local sky. SWPC says you need clear or mostly clear skies. Aurora forms far above the clouds, but clouds still block the view.
- Go dark and face the pole. Leave city lights, find an open horizon to the north, and wait. SWPC says a hill with a clear northern view can show aurora about 1,000 km (600 miles) farther north.
NOAA’s experimental aurora dashboard collects these elements on one page: the NOAA scales, solar wind speed and magnetic field values (Bt and Bz), the Kp index, the hemisphere maps, and Kp effect maps for Kp 3, 5, 7 and 9.
The aurora forms 80 to 500 km up, in two ovals around the magnetic poles
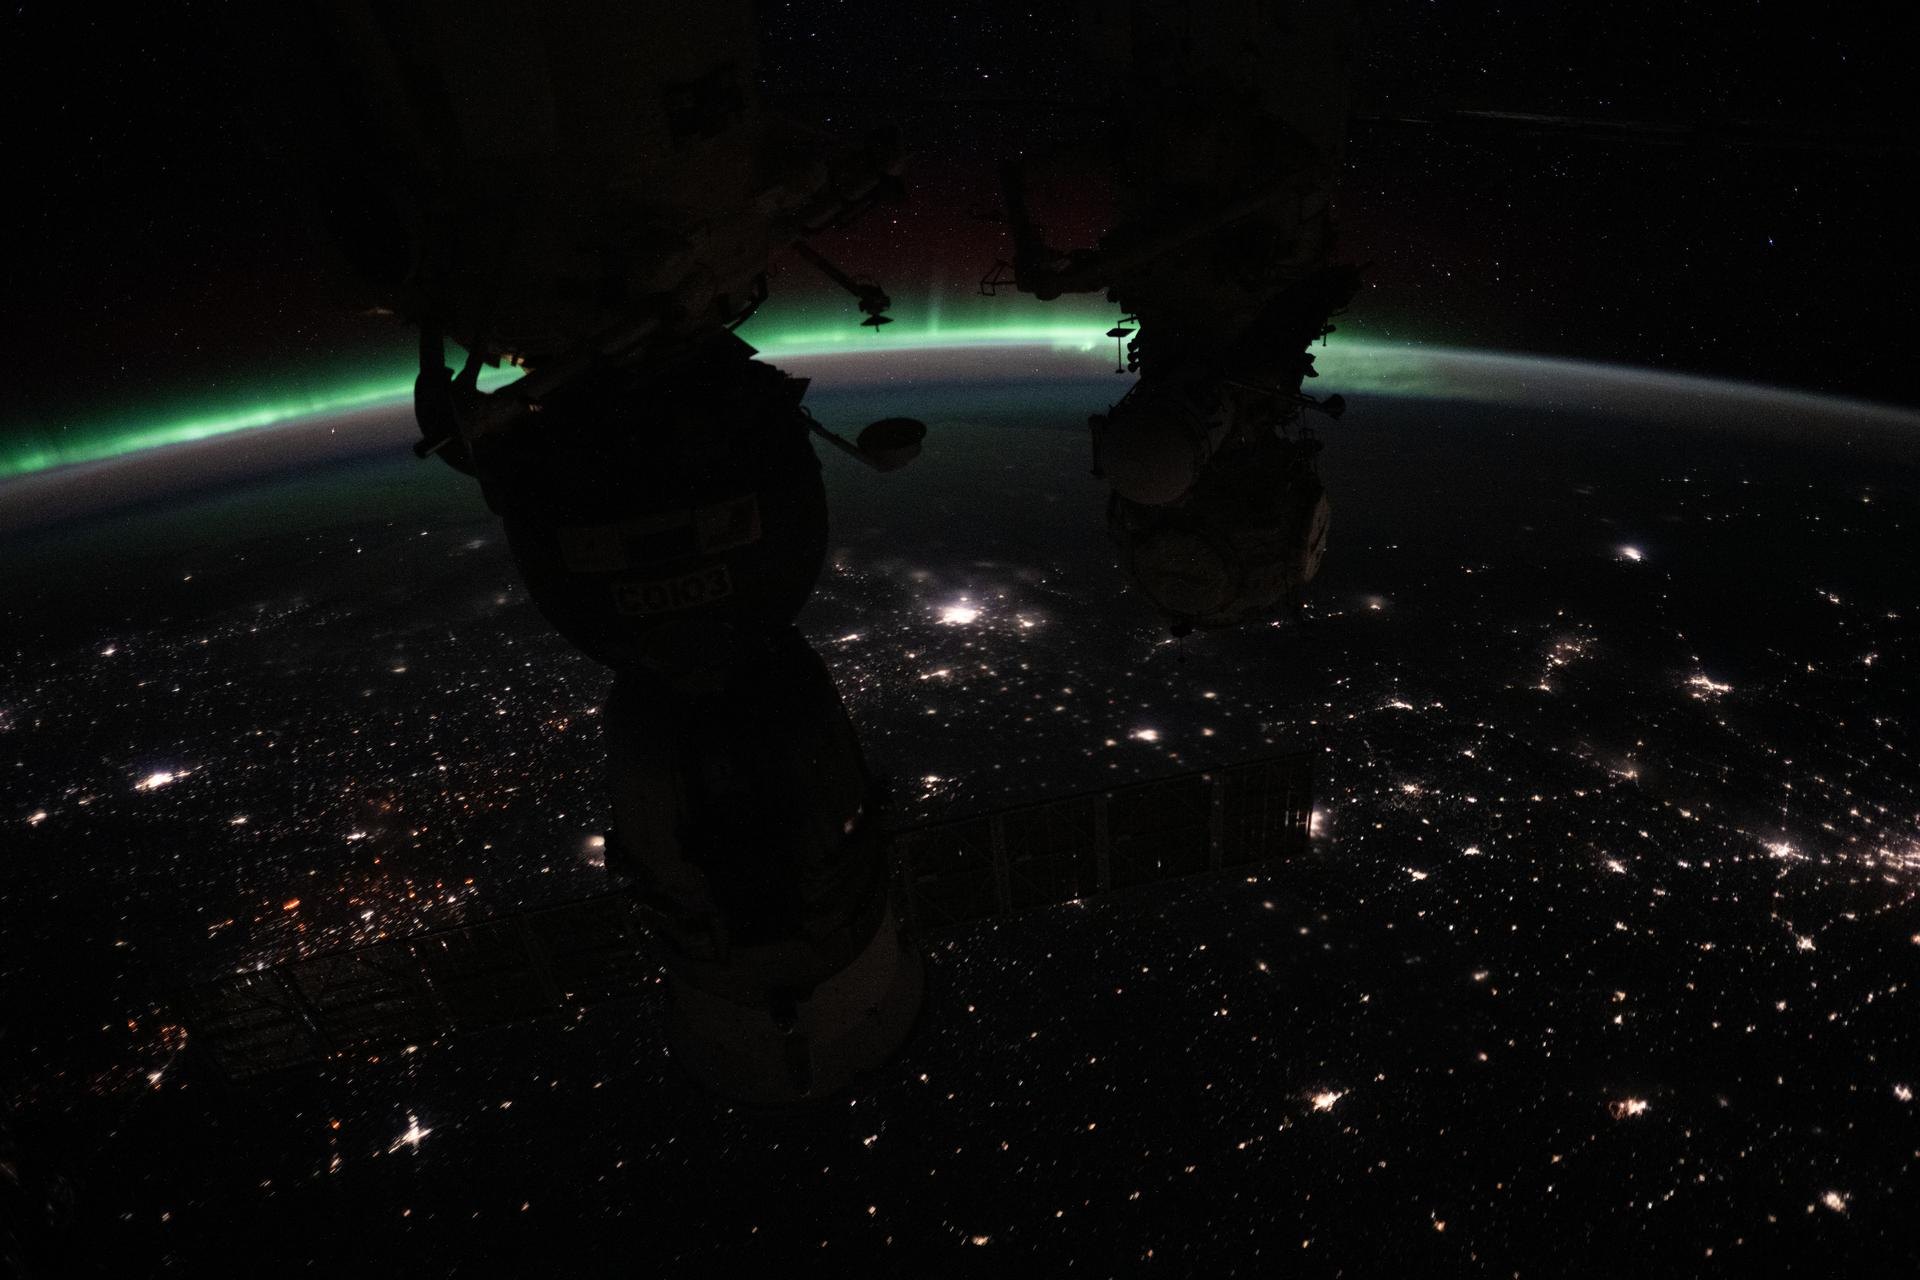
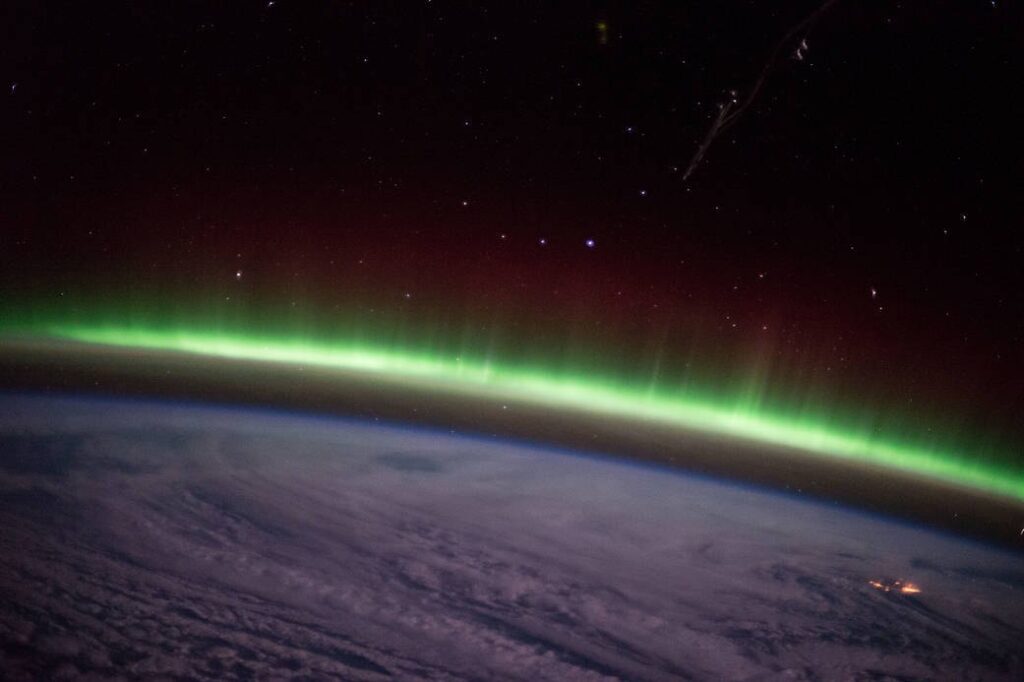
According to SWPC, aurora results from electrons colliding with the upper reaches of the atmosphere. Electrons accelerated on the night side of the magnetosphere follow Earth’s magnetic field to the polar regions, where they hit oxygen and nitrogen. The atoms release energy as light. The aurora typically forms 80 to 500 km above the surface.
Earth’s magnetic field shapes aurora into two ovals centered on the magnetic poles, so the lights are not centered on the geographic pole. SWPC gives the best viewing area as between about 60 and 75 degrees north or south latitude. During major geomagnetic storms the ovals expand away from the poles, and in large events aurora can reach the US, Europe and Asia.
“Aurora borealis” and “northern lights” are the same phenomenon. The Southern Hemisphere counterpart is the aurora australis, and NOAA’s 30-minute forecast has a map for each.
Alaska and Iceland have their own forecasts for local cloud and darkness
Fairbanks sits under the oval, so storm-level Kp is not needed. The Geophysical Institute’s article on aurora season says aurora occurs all year but is least common near the solstices, is not visible in summer because of long daylight, and is best at roughly 11 p.m. to 1 a.m. Check the institute’s own forecast pages for current outlooks.
For Iceland, the Icelandic Met Office page on aurora forecasts gives auroral activity on a scale of 0 to 9 for midnight, and a cloud map up to six days ahead at 00, 06, 12 and 18 hours. On that map, green areas are cloudy and white areas are clear. Because Iceland’s weather changes quickly, that cloud map often decides where to go more than the activity number does.
For Norway the same logic applies: choose a month with real darkness, a place under or near the oval, and a clear sky.
Common questions
What time can the northern lights be seen tonight?
SWPC says the best aurora is usually between about 10 PM and 2 AM local time, and the window widens toward evening and morning when activity is higher. In Fairbanks the Geophysical Institute points to roughly 11 p.m. to 1 a.m. To know about tonight, check the 30-minute forecast map after dark.
Who can see the northern lights tonight?
It depends on Kp and latitude. At Kp 5 (G1), NOAA says aurora is commonly visible at high latitudes such as northern Michigan and Maine. At Kp 7 (G3) it reaches down to Illinois and Oregon, per NOAA. Clouds, moonlight and city lights can still block the view.
Where are the northern lights visible?
Mostly in an oval around the magnetic pole, with the best viewing between about 60 and 75 degrees latitude, according to SWPC. Alaska and Iceland are inside that band. In major geomagnetic storms the oval expands and aurora can be seen across much of the United States.
What causes the northern lights?
Electrons guided by Earth’s magnetic field collide with oxygen and nitrogen in the upper atmosphere, typically 80 to 500 km up, and the atoms release energy as light. Solar wind conditions upstream of Earth, measured at L1, drive how strong this becomes.
All figures on this page were checked against the official pages named above on October 17, 2026.