Landsat maps show forests drink more than crops, and crops keep drinking in drought
A NASA-reported study used Landsat and OpenET to track water loss from fields and forests from 2016 to 2022, and found crop water use barely dipped in drought as groundwater declined.

Researchers using Landsat satellite data have mapped how much water crops and forests lose to the air across the Lower Mississippi Alluvial Plain from 2016 to 2022, NASA reported. Crop water use held steady in drought while modeled groundwater storage kept falling.
Seven states, one floodplain, and a heavy reliance on groundwater
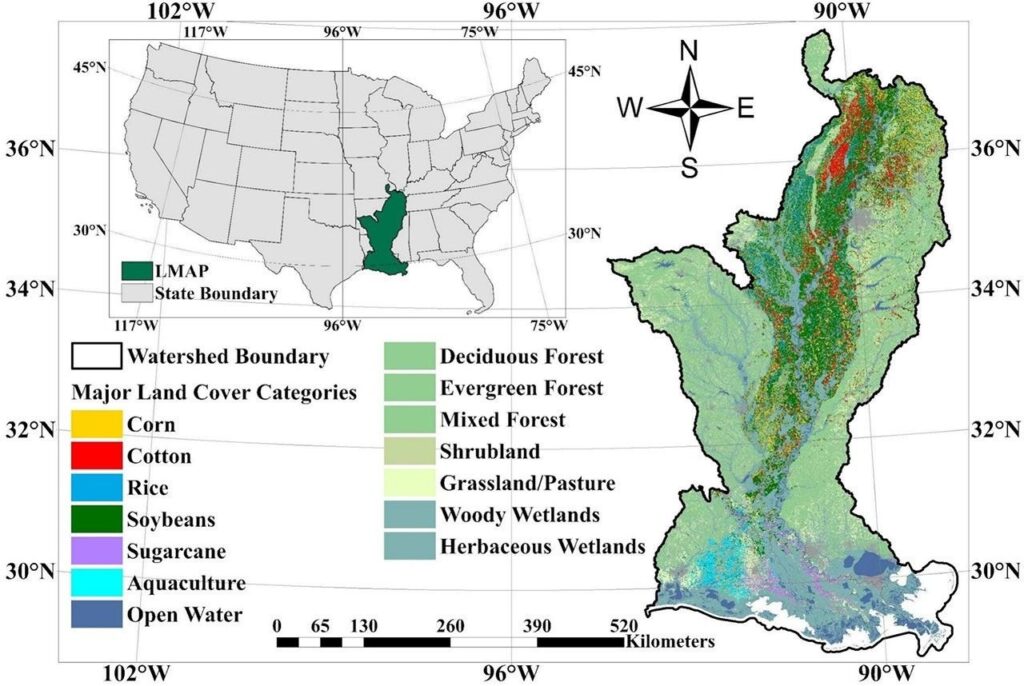
The Lower Mississippi Alluvial Plain (LMAP) is a flat, fertile region along the lower Mississippi River that stretches through seven states. It is a major U.S. farming region, and in the hotter, drier summer months its crops depend heavily on groundwater for extra irrigation. NASA says overuse has pushed aquifer levels down, which threatens both farming and people elsewhere who draw on the same aquifers.

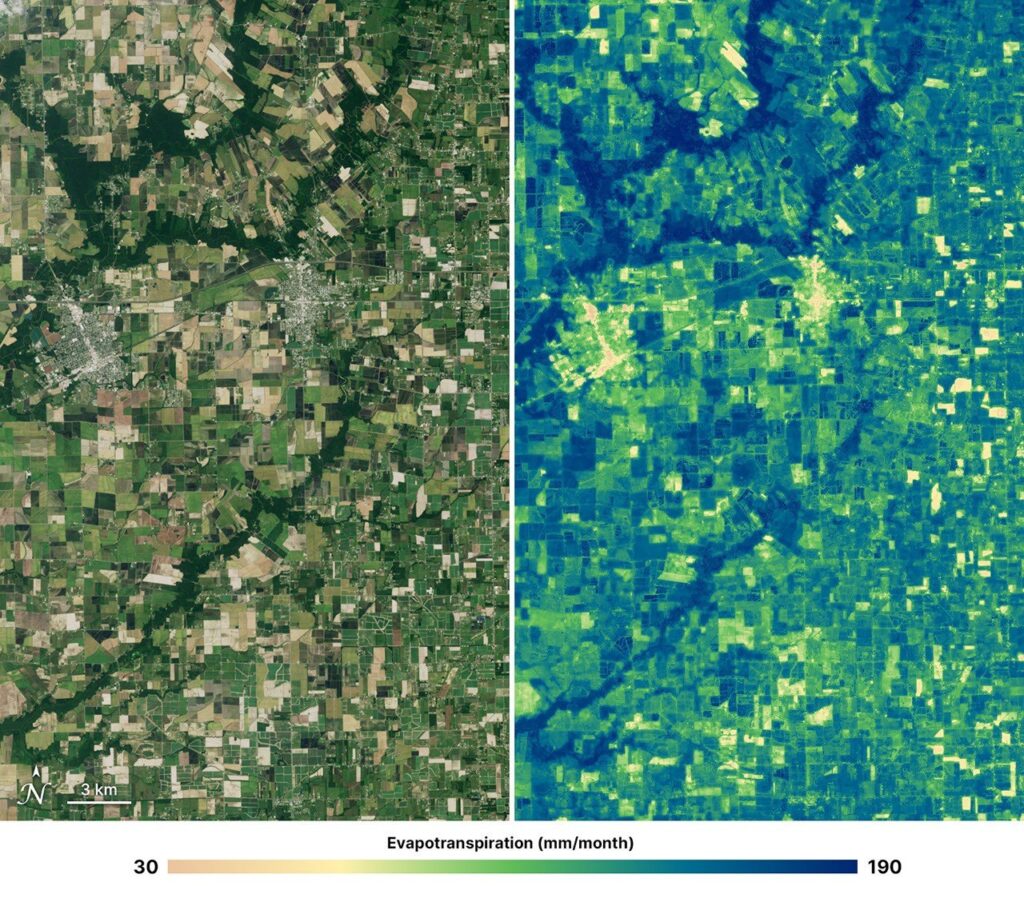
The study, led by Weina Duan of Cornell University, used OpenET, an open-source platform that estimates evapotranspiration (ET). ET is the total water lost from land to the atmosphere: water evaporating from soil plus water plants release through pores in their leaves. The platform combines Landsat measurements, including surface temperature, with weather data and models. Each map pixel covers 30 by 30 meters, about 0.22 acres, so individual fields can be compared day by day, month by month or season by season.
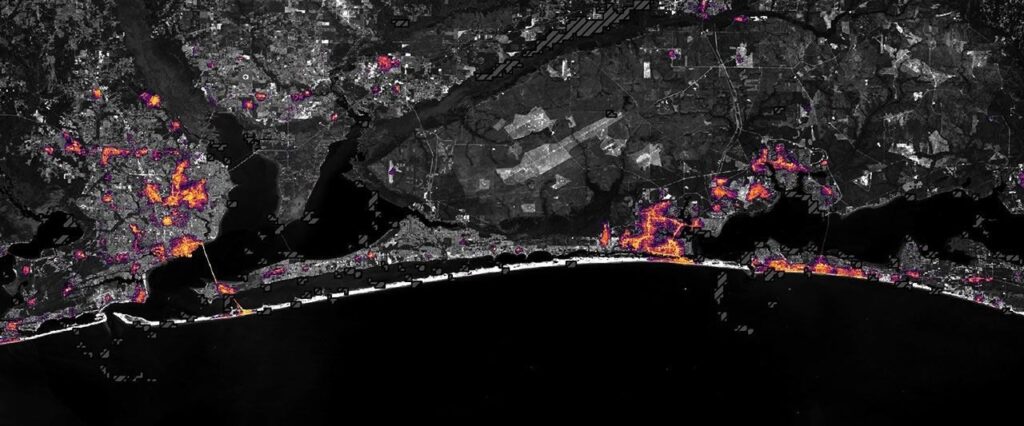
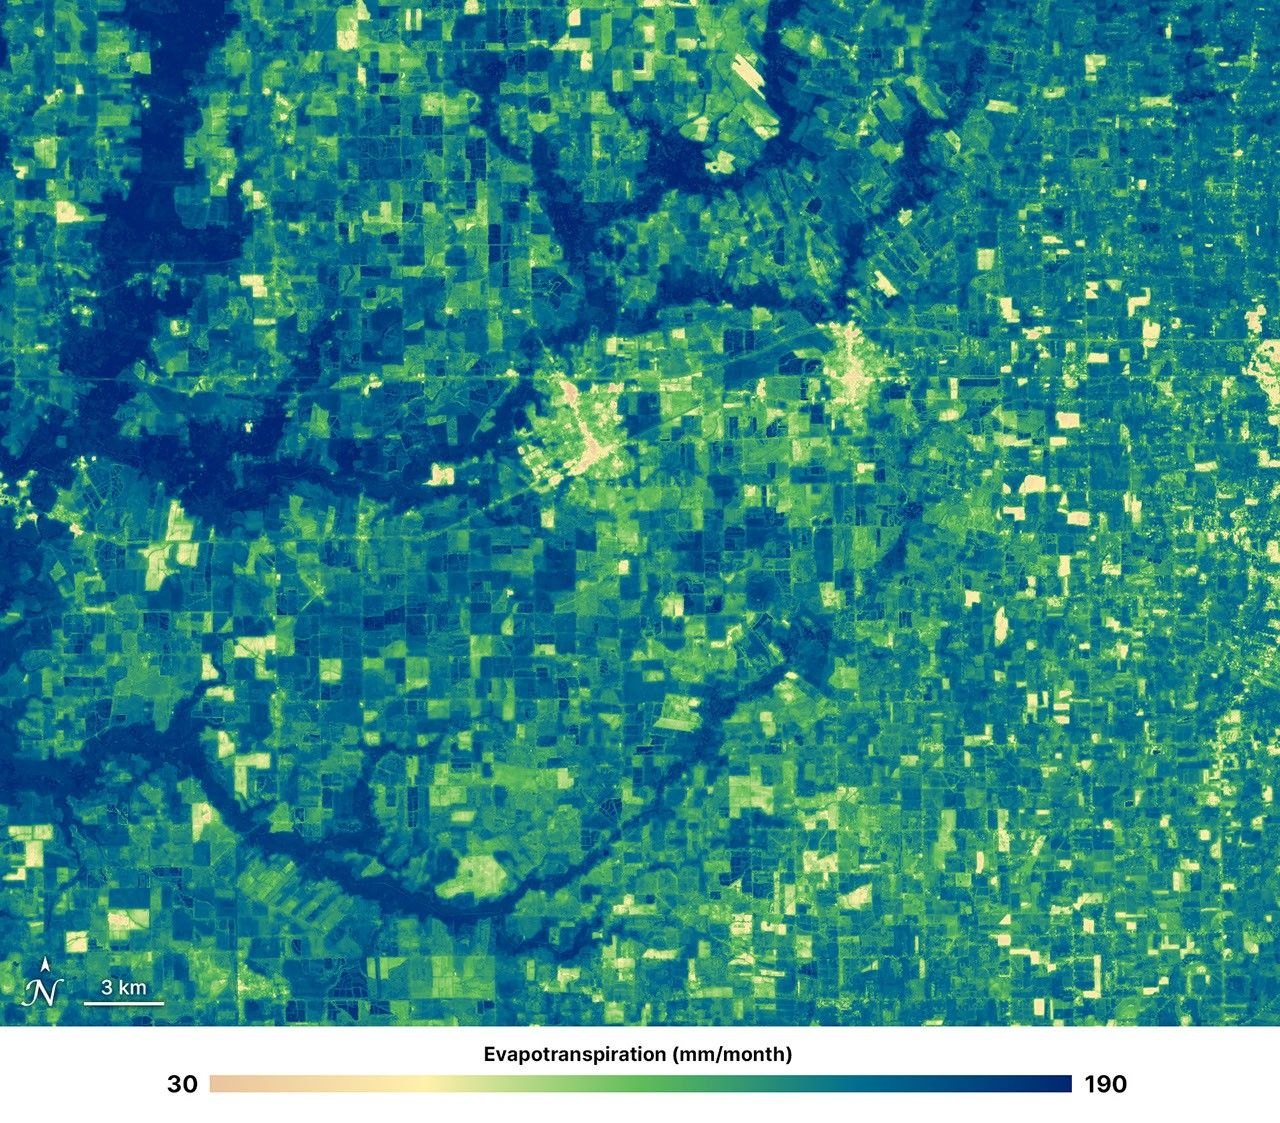
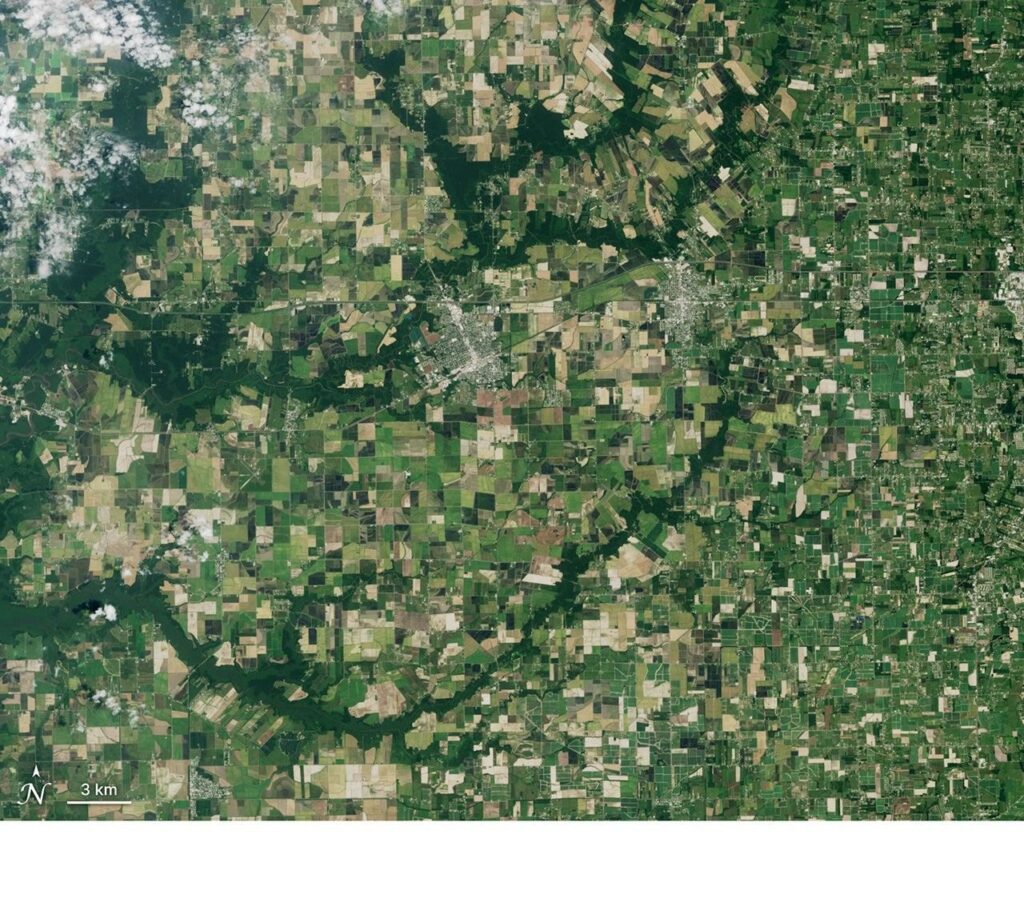
The team analyzed monthly data for soybeans, corn, cotton and rice, with nearby forests as a less-managed reference, and checked results against U.S. Drought Monitor data. NASA’s example image of Rayne and Crowley, Louisiana, for July 2026 shows the range: about 30 mm of water per month in towns and fallow fields, 160 mm in irrigated cropland and up to 190 mm over the bayous.

What the seven years of data showed
All four crops and the forests peaked in July, but crop ET varied more than forest ET, depending on crop type and how each field was managed. Forests used more water overall. When drought worsened, stress indicators for crops reacted faster than those for forests, which the authors read as greater forest resilience to dry soil. NASA notes that deep tree roots may let forests reach groundwater.
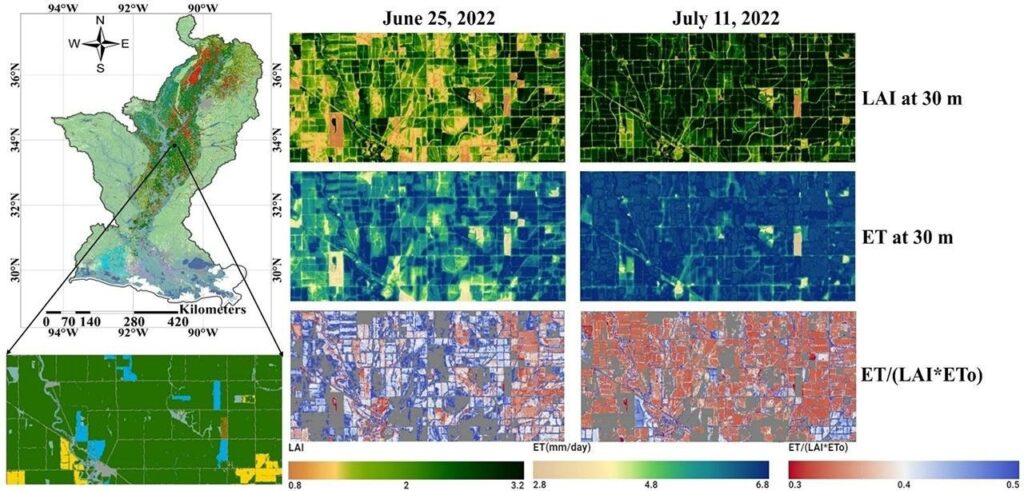
The most telling result concerns the crops. Their ET stayed relatively stable even as rainfall fell, while modeled groundwater storage showed growing depletion. That pattern suggests irrigation helped sustain crop water use as drought developed. Maps of soybean fields during the 2022 drought, comparing June 25 and July 11, show neighboring fields diverging, which NASA attributes to different management by farmers.

Yun Yang, a Cornell assistant professor and principal investigator of the NASA Acres-supported study, said the work shows how Landsat-based products reveal “differences in water use across crops, forests, and drought conditions at the field scale.” The paper appears in the International Journal of Applied Earth Observation and Geoinformation (doi:10.1016/j.jag.2026.105172).
Free public-sensor maps versus a commercial fleet
The approach rests on Landsat, a government program, and OpenET’s data is open. That puts it in a different position from the commercial thermal-imaging fleets now being built for the same job. Hydrosat plans four Earth-imaging satellites with visible and near-infrared cameras plus long-wave-infrared sensors that detect heat, and NASA said prelaunch calibration of its visible-near-infrared cameras finished on Oct. 30 at Goddard, as we reported. Its stated goal is spotting patches of a field that are starting to dry out, so a farmer could water only stressed plants.
The two efforts overlap more than they compete. OpenET’s own site lists NASA, USGS, Google Earth Engine, Cornell and DRI among its partners and says it is expanding globally, including an OpenET Brazil project supported by Brazil’s national water agency. A public archive gives researchers a consistent record that stretches back years, which is what made a 2016 to 2022 drought comparison possible. A commercial fleet would aim to add finer detail on top. Neither source says how the Hydrosat data would be combined with OpenET.
NASA says the method could be applied wherever groundwater or surface-water supplies are shrinking, with the aim of helping farmers and water managers plan irrigation before shortages worsen. It also points out that forests, while valuable ecosystems, can add pressure to groundwater in dry periods.